The OC curve is the curve where the percent defective per lot 'p' lies on x-axis and the probability of acceptance 'Pa' on y-axis. The acceptance plan can be stated as (n,c) where n is the sampling size and c is the limiting number of defectives (acceptance number).
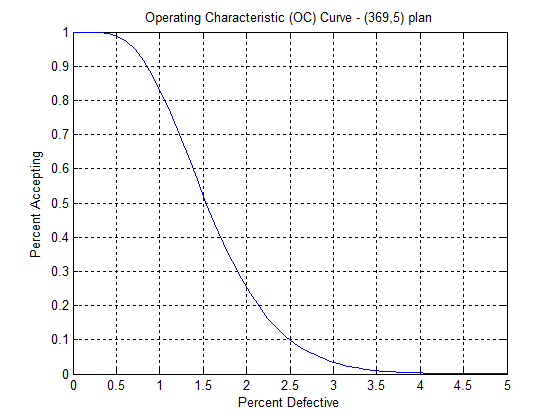 It is actually an application of the binomial distribution where Pa is the probability that d, the number of defectives, is less than or equal to c.
My MATLAB code for ploting such a curve is simply:
p=linspace(0,0.05,50);
Pa=binocdf(c,n,p);
plot(p*100,Pa);
To create a sampling plan, instead of using the MIL table (or any table), it is better (and easier) to use Minitab 15: Stat->Quality Tools->Acceptance Sampling by Attribute...
 Minitab also gives you the AOQ and ATI alongs with a detail session report.
No comments:
Post a Comment